Broker Home
You can get general broker information and status infos on the "Home" page of the broker. You navigate to the home page by clicking on a broker in the broker overview of a project.
There are different layouts for the broker home page depending on the state of the broker and the installation type.
Cloud
Single Node
For a running broker instance, you will get the following overview dashboard:

At the top of the page you can see the assigned broker name and the current state (stable, offline, provisioning). Below that the assigned name of the broker is shown.
A section with connection infos displayed. It provides the broker url. An arrow is displayed to the left of the url to expand or collapse more infos about available ports and their configuration options. Clicking on the copy button will copy an url string with protocol, url and port into the clipboard for further use.
Below that, you can observe two sections. One displaying the current status with some key metrics and the option to navigate to the topic tree inspection or client inspection. Right to that the current license plan parameters are listed.
Below that is a section to display the broker location, url and version.
Finally, if you scroll down, a section with the status of active bridges is displayed:

Here you can observe statistics or warnings/errors for the bridges. The content depends on the type of bridge.
Cluster
For a running broker instance, you will get the following overview dashboard:

The top sections display the same infos as for the single node. The 'Broker' section is replaced by a 'Cluster' section. Here you get additional infos about the cluster config:
- Cluster Mode
- Internal Cluster Name
- List of Cluster Nodes showing name, state, IP-Address, Uptime and status flags
Provisioning
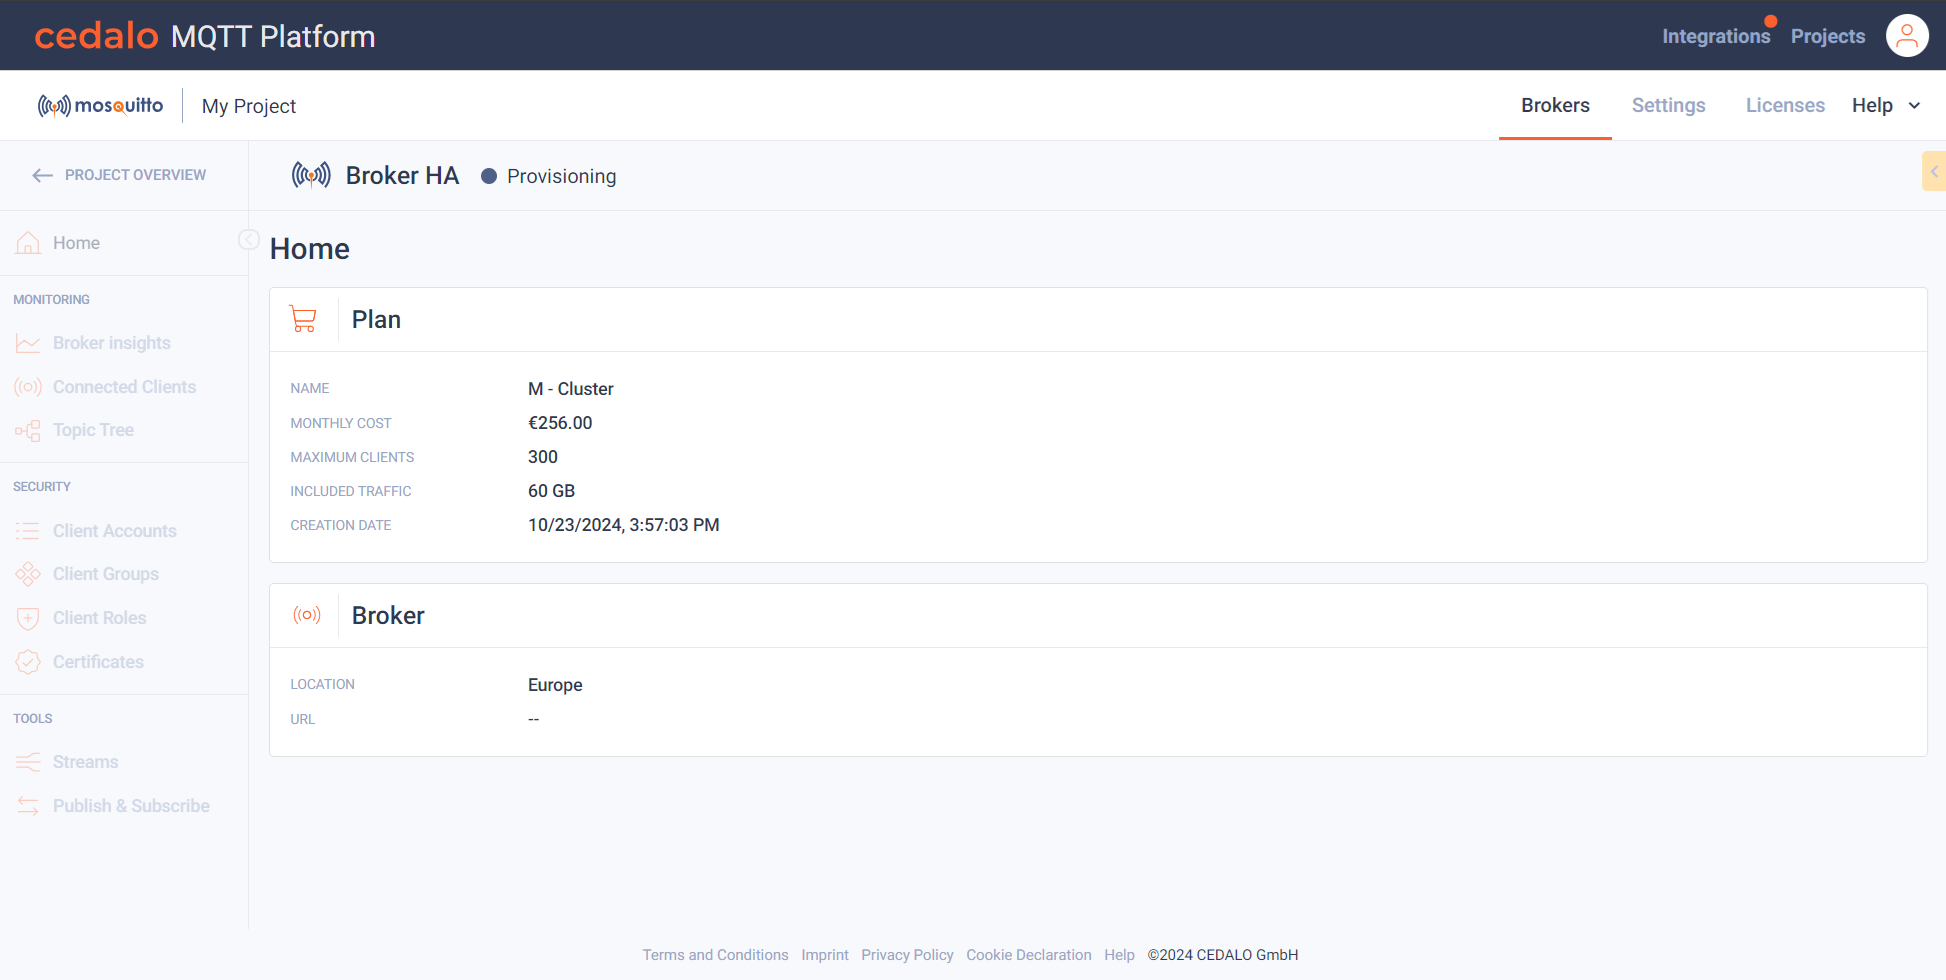
The following view is shown, while a cloud installation is going on:

You can view your booked plan parameters and the location of the broker, you selected. While the provisioning is running the state indicator right to the broker name is flashing.
On-Premises
If the broker is an on-premises broker, booked with the Cedalo MQTT Platform, the following overview will be shown:

Here you will get infos about your license plan, download infos and a list of versions available for download.