Stream Functions
Streams are the heart of a Streamsheet. They transfer information in and out and give the applications you are building their purpose. Add stream functions to connect the Streamsheet to the outside world. If you don´t know yet how to create streams click here.
Stream Function Wizard
Usually Functions are created by entering “=” followed by the name of the function in a cell. This process is supported by the function inline help, which prompts suggestions and parameter support.
To further simplify the creation of functions the "Stream Function Wizard" was added. The Fuction Wizard supports mainly the creation of so called Stream Functions. These are functions which use a Stream (Producer/Consumer) to communicate with entities outside of an App and usually are of a more complex structure than regular functions.
To open the "Stream Function Wizard" select the cell, where the function should be inserted and click in the top bar on the Function Wizard Icon. The Wizard will open on the right side of your screen. Now first select the Stream Function followed by the Stream. Depending on the chosen Stream Function a set of different other parameter is required.
When finished click “Ok” to eventually create the function.
Note: In version 1.5 the icon for the stream functions was changed
![]()
Create a MQTT.PUBLISH function with the Function Wizard
HTTP Request
This tutorial covers two different kind of HTTP/REST Calls, one is POST and the other is GET. (In older versions of Eclipse Streamsheets we use the term REST, which is changed to HTTP starting v1.6) The differences are that with a "POST" information is transmitted from the HTTP Client to a server and a "GET" transmits information to the HTTP Client from the server. To add a HTTP function to a Streamsheet you will need a Connector and a Producer, based on the HTTP Client Provider. Start by creating the Connector in the Stream Tab of your Dashboard. You can leave all fields empty to be able to utilize this Connector for any URL. If you want to create specific Connectors for every webpage, type in the Base URL. Same goes for the Producer. Create a Producer based on the just created Connector and leave it empty. We can now select the Producer within the Function Wizard.
1. Method "Post": As an example, for a HTTP Request with the method "POST", we will create an alert service for Slack. Slack is a messenger, which offers the possibility to add self-made applications. This option will be used to add an Alert Application to a Slack channel, posting status updates.
To begin create such an App in Slack and add an Incoming Webhook. This generates the HTTP.Request URL we will be posting information to. Choose a Channel on Slack to add your Application to. This is where we will post the information to. Now we can start building an App in Streamsheets. Create a new App and create a JSON Range with the key Value being “text” and the Value being any message you would like to send. Create a HTTP Request function over the Function Wizard and select "POST" as the method. Add the created URL and select the JSON Range as the body. Choose a Target (e.g. a cell range) for the response message of the server. Now with every new Step, the App will send your message to Slack 😊
2. Method "GET": The "GET" method is very similar to the "POST" method, but in this case we do not need to define any message, because we will be consuming messages. A good example is the “API of Ice and Fire” https://anapioficeandfire.com/. It is an HTTP Request based online wiki for Game of Thrones related information. Depending on the URL, different Information can be accessed and displayed. Lets choose the following URL: https://anapioficeandfire.com/api/characters/583 It displays all information regarding Jon Snow in a JSON-Object. So lets again create a new App. Add a HTTP Request Function with the help of the Function Wizard. Enter the URL, select "GET" as the method and chose the Target, where the information should be displayed (e.g. INBOX). Confirm your input by clicking “OK”. After starting the App the requested information will now appear in the Target Range.
OPC UA
![]() This is a premium feature.
This is a premium feature.
This simple Tutorial shows how to read information of an OPC UA Server. To begin with, we have to create Streams, which are connected the OPC UA Server of our choice.
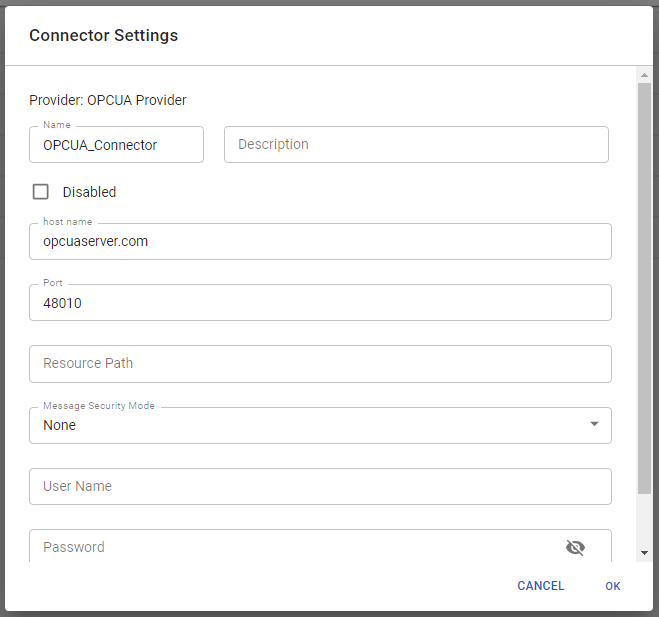
Open up the "Stream" tab of your Dashboard and create a new Connector based on the OPC UA provider. Enter the URL of the Server you want to connect to.
You can find example OPC UA server at http://opcuaserver.com/. To connect to the Streamsheets internal OPC UA server use streamsheets-service-opcua as host name and api/v1.0/OPCUA/cedalo/machineserver as the resource path. Make sure the server is set up.
Receive OPC UA values
There are multiple ways to access OPC UA data. Configure a Consumer to poll data in a set interval, or use a function in your sheet to trigger a single request to the OPC UA server. The now following producer and consumer need the specific node ids of your OPC UA parameter. These consist out of a namespace indicator and the parameter id. (e.g. ns=2; s="Parameter"). We are working on a feature to directly scan and access existing OPC UA nodes through Streamsheets. Until then, it is necessary to detect the node ids by hand. A good tool to identify nodes could be the Prosys OPC UA Client or UAexpert. You can also use a browser client: https://www.uaclient.com/
Example Connector
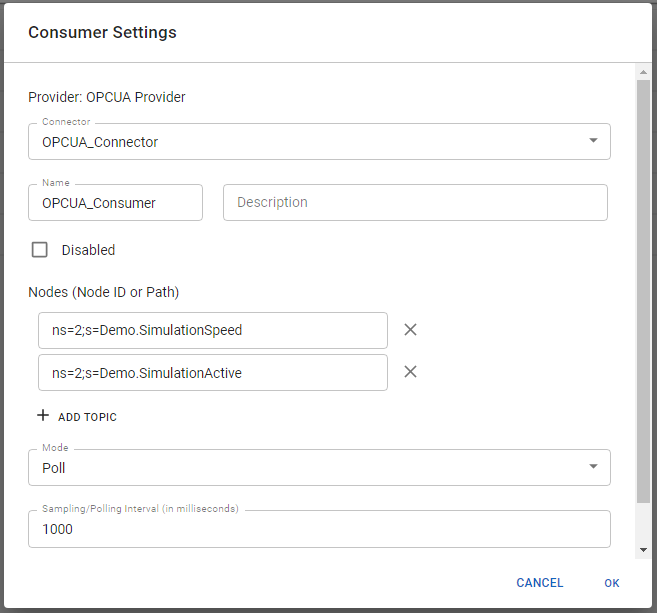
OPC UA Consumer: Create a new Consumer, based on the created Connector. Enter the node id(s) you are interested in and save your changes (the polling interval defines the interval where the Consumer requests new data from the server). Now we are ready to poll information from the specified server. Create a new App and select the newly created Consumer. Just start the App and the Consumer will instantly forward messages into the Inbox.
Example Consumer
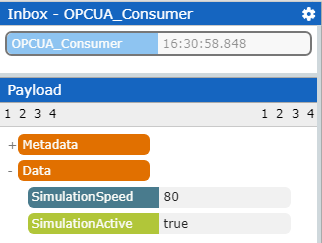
Example Payload
OPCUA.READ(): The second way to request data from an OPC UA server is via OPCUA.READ. Start by creating a Producer based on the above created Connector. In an App open up the Function Wizard, select the OPCUA.READ function and choose the created Producer. Enter the Node ID and the Target (e.g. INBOX) and confirm your input by clicking “OK”.
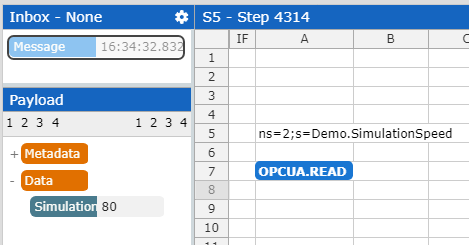
Every new calculation step now triggers OPCUA.READ and therefore a request to the OPC UA server. As soon as the response arrives, the function will be displayed in the assigned Target.
Transmit OPC UA values
OPCUA.WRITE: It is also possible to update existing OPC UA Variables with the OPCUA.WRITE formula. Similar to before, use the Function Wizard and select OPCUA.WRITE. Choose the right Producer, add the node id range and target.
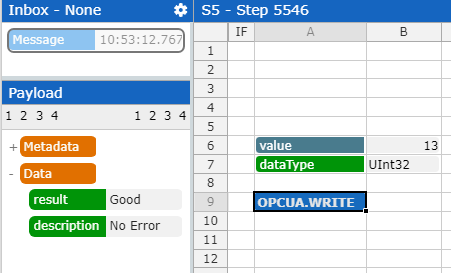
The Node Value Range has to consist out of two key value pairs. The value itself, to be written on the node id, and the data type to be used.
Host OPC UA Server
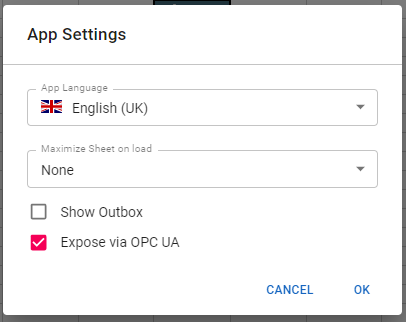
Streamsheets can not only connect to OPC UA Server, but also act as one. To acivate the OPC UA server path for an application you are creating, open the "App Settings" in the navigation menu on the left side of your app and turn on "Expose via OPC UA".
Now the app has it´s own path on the internal OPC UA server, under which it can be reached. The base path is:
api/v1.0/OPCUA/cedalo/machineserver
To create your own nodes on the server you will need the function OPCUA.VARIABLES(). This function then covers a range of key value pairs, which then will be set as nodes on server. If the values change on the sheet, the nodes change on the server.

We are working on a OPC UA node discovery tool. Until then use a OPC UA Client tool to identify nodes ( Prosys OPC UA Client or UAexpert ). A typical node id looks like this:
ns=1;s=S1GXQxFYZP.rkN-uZ8aI.example.param1
To change a node´s value through a client you will have to implement one more thing. In the Inbox, of the sheet you are using for OPCUA.VARIABLES(), all client writes will appear. Map a READ() function to always directly change the value of your key value pair, so the calculation of the OPCUA.VARIABLES() function will change the node on the server.

Tipps:
- The function OPCUA.VARIABLES() has to run once to create the nodes on the server
- Always add a top level element in the range (e.g. "example")
- It makes sense to change the calculation mode of the sheet to "on message arrival"
TimescaleDB
![]() This is a premium feature.
This is a premium feature.
The premium version of Streamsheets comes with a TimescaleDB installation. There is no need to set up any streams, the Timescale functions automatically connect to the database. It is a time series database (TSDB), which is a software system that is optimized for storing and serving time series through associated pairs of time(s) and value(s). It is based on PostgreSQL. To learn more check their website .
To work with Timescale, Streamsheets uses a bunch of different functions. TIMESCALE.INSERT, TIMESCALE.SELECT, TIMESCALE.CREATE_TABLE, TIMESCALE.SHOW_TABLES, TIMESCALE.DROP_TABLE and TIMESCALE.EXPORT.
The two most important functions are the inserting and selecting of data:
TIMESCALE.INSERT()
=TIMESCALE.INSERT(, TableName, ValuesJSON [, TableSchemaJSON])
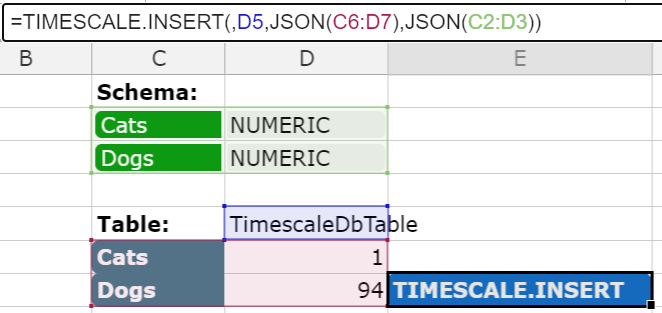
To fill a data table with information you can use the insert function.
Stream: Leave empty to connect to integrated TimescaleDB
TableName: Enter the table where the data should be saved.
ValuesJSON: Enter a JSON with the data to be saved. E.g. JSON(A1:B4)
TableSchemaJSON: If you want to write data in a new table, you don´t necessarily need to use TIMESCALE.CREATE_TABLE. Adding your schema to the function will automatically create a new table, while inserting data.
The schema describes the structure of your table. It refers to the organization of your table. Here you have to set the parameter names you want to save within your table and assign their data types. (E.g. "value1";"NUMERIC") Accepted data types are NUMERIC, TEXT, TIMESTAMP, TIMESTAMPTZ, DATE, INTEGER etc.
TIMESCALE.SELECT()
=TIMESCALE.SELECT(Stream, SelectJSON [, Target, XValue,])
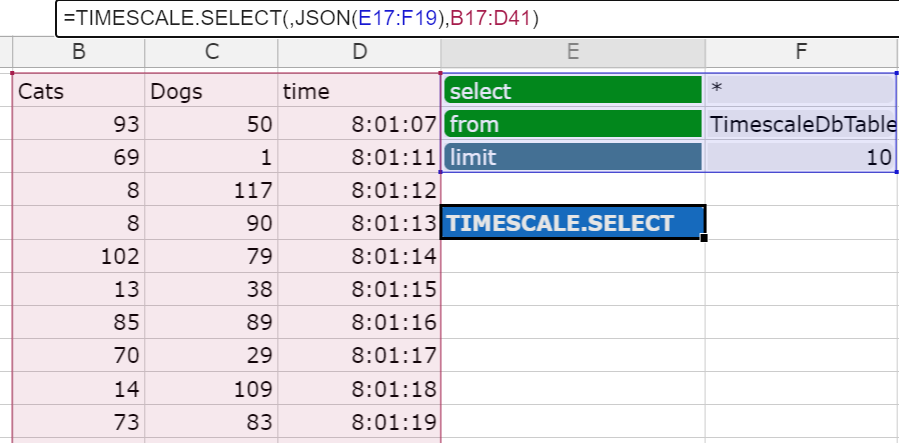
Select all from table "TimescaleDbTable", but limit response to 10.
To query data use the select function. The select function uses the postgreSQL commands to query your data. Use a data range on your sheet to set your query command. These use the parameter value format. Use parameter like "select", "from", "where", "limit", "order by" etc. and define the command within your value cell.
Examples:

selecting "time" and "Sensor1" values for all "Sensor1" data over 40

selecting max "time" and renaming the parameter in the response using the "as" command.

selecting all saved parameter for a certain message id and limiting the amount of responses to 10. +
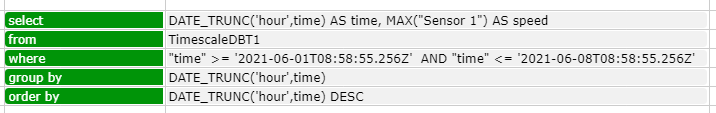
selecting the maximum value of "Sensor 1", in hourly time intervals, within a certain time frame, ordered descending by time interval, named "speed".
The select has to be a JSON, so use the JSON() function around the statement range.
Chart range:
You are able to base a chart range on TIMESCALE.SELECT() and display the response in e.g. a XY Chart. To do so, add the X axis parameter name for the chart in the TIMESCALE.SELECT() "XValue" parameter. E.g.: If you want to display the time in the x axis of your chart choose this function:
=TIMESCALE.SELECT(,JSON(A1:B3),,"time")
Now the time parameter will be displayed in the x axis of your chart. The chart only needs to reference the select function as data source.
Timescale Tips&Tricks
TimescaleDB is based on the postgresql Syntax. Streamsheets simplifies the creation of queries by using key and value pairs for a better overview. The key always resembles the command (select, from, where, etc.), while the value is used to define the details (What do you want to select? What is the table name? Any restrictions?).
Besides the regular sql syntax, there are a couple of things worth mentioning. If you need a quick overview of possible syntax click here.
- While saving a message Streamsheets automatically assigns the current timestamp. If you want to change this, add "time" to your schema and use a data type like
timestamportimestamptz. Your value has to be in a certain form. E.g. '1999-01-08 04:05:06'. Use single quotation marks around the value. For more information on the time syntax click here. - Commands must be written in lower case (select, from, etc.).
- Use double quotation marks around parameter names. E.g. MAX("Parameter").
- Use single quotation marks around dates, intervals and timestamps (SELECT TRUNC(TO_DATE('27-OCT-92','DD-MON-YY'), 'YEAR')).
MongoDB
To store data and retrieve information Streamsheets are able to connect to a MongoDB. Here you can learn how to add a MongoDB to your current Streamsheets installation.
Start connecting the MongoDB to your Streamsheets by setting up a MongoDB Connector. Enter the URL (or if working with Mongo for Docker the container name) in the Host(s) field. All other settings are optional. Streamsheets offers five Mongo specific functions within the Function Wizard: OPCUA.READ, MONGO.COUNT, MONGO.DELETE, MONGO.QUERY and MONGO.AGGREGATE. Setup a Producer on top of the just created Connector and you are ready to go.
In a Streamsheet open the “Function Wizard” to gain convenient access to the MongoDB functions.
MONGO.STORE()
=MONGO.STORE("Stream","Collection","Document")

As soon as your MongoDB Connector and Producer is set up you can start storing data. Click on a cell, open the function wizard and select MONGO.STORE. Remember the calculation order of a Streamsheet (top to bottom, left to right), this might play a role in the structure of your logic.
Stream: The “Function Wizard” automatically selects a stream. Make sure the right one is selected.
Collection: MongoDB has different places to store data at. These are called collections. Type in a name of a collection. The collection will automatically be created, if not already existing.
Document: The document contains your data. It is a simple cell range of key and value pairs. It is also possible to order them in a hierarchy.
With every calculation one document will be stored in the selected collection.
MONGO.QUERY()
=MONGO.QUERY("Stream","Collection","Query","Target","ResultKeys","PageSize","Page","Sort","Timeout")

To lookup data from a MongoDB collection use the function MONGO.QUERY. It is possible to access either all stored documents or a subset of them.
Stream: Again select the right Producer to connect to the right database.
Collection: Type in the collection you used in the MONGO.STORE function.
Query: The query filters the data and only gives back documents, which are match or are composed of the query. Define one or more key value pairs the documents you are searching for have to contain. E.g. you have saved a lot of customer information and now need the information for all customer with the name “Julia”, define a horizontal cell range containing “name” on the left and “Julia” on the right. To access all data just leave this section empty.
Target: Define where the response of the database should be displayed. Choose a cell range or =INBOX(); =OUTBOX() as a target. Be careful, the cell range maybe to small to display all information.
Result Keys: The Query always gives back all the information saved in a document. If you are only interested in a subset write each key in a cell and enter the cell/ cell range in the Result Key field.
Page Size: The Page Size defines how many results will be shown in the response of your query per page. As a default, page 1 will be returned.
Page: Select the page you want to get back. Example: Enter page size = 5 and page = 2. The query will return entry 6-10.
Sort: You can either sort by time using 1 and -1 or you can sort alphabetically by using a cell range with the key to sort with and a 1 or -1. 1 = descending; -1 = ascending.
Timeout: Tells the function how long to wait for a response from the database(in ms).
MONGO.DELETE()
=MONGO.DELETE("Stream","Collection","Query","Target","Timeout")

Delete documents in a collection.
Stream: Select the Stream connected to your MongoDB.
Collection: Enter the collection you want to adjust entries in.
Query: All documents with the defined key value pair/s will be deleted from the collection.
Target: MONGO.DELETE returns the amount of objects that have been deleted. To get this information define either a cell range of at least 2x2 or enter =INBOX()/=OUTBOX().
Timeout: Tells the function how long to wait for a response from the database(in ms).
MONGO.COUNT()
=MONGO.COUNT("Stream","Collection","Query","Target","Timeout")

If you are interested in the amount of documents stored in a collection use MONGO.COUNT().
Stream: Select the Stream connected to your MongoDB.
Collection: Enter the collection you want to count entries in.
Query: Enter a cell range of key value pairs. All documents with the defined key value pair/s will be counted.
Target: MONGO.COUNT returns the amount of objects that have been counted. To get this information define either a cell range of at least 1x2 or enter =INBOX()/=OUTBOX().
Timeout: Tells the function how long to wait for a response from the database(in ms).
MONGO.REPLACE()
=MONGO.REPLACE("Stream","Collection","Query","Document","Upsert")

To replace data in a collection, use the MONGO.REPLACE() function.
Stream: Select the Stream connected to your MongoDB.
Collection: Enter the collection you want to replace entries in.
Query: The query searches for documents within a collection to replace.
Document: Define a document to replace existing data with and enter the cell range here.
Upsert: TRUE or FALSE. Upsert decides, if, when a query can´t be found, the document is added to the collection or dismissed.
Here is a small example:
All five Mongo functions used in one GIF.
Note: In version 1.5 the icon for the stream functions was changed
![]()
InfluxDB
To store data and retrieve information Streamsheets are able to connect to a InfluxDB.
First of all we start by providing a HTTP Client Connector and the corresponding Producer. If these are not yet available, go to the Administration menu and create a new Connector and Producer. If you have any questions we recommend to have a look at the HTTP Request Tutorial.
Create a Database:
Create a database using the REST.REQUEST function. Click on the
functionwizard, select the right Producer and use the POST Method. Add
the desired database name at the end of the URL.
URL: http://influxdb:8086/query?q=CREATE DATABASE <Database name>
Example URL: http://influxdb:8086/query?q=CREATE DATABASE mydb
To create a database it is sufficient to execute the REST.REQUEST once.
Write Data:
To write data into the InfluxDB, we have to use the REQUEST function.
The ParameterJSON range of the function contains 4 parameters. The first
is the URL which must contain the name of the database. It`s also
possible to add a password, precision etc. The second one is the method
which is POST when writing the data into the InfluxDB. Third is the body
in which the data is located. To successfully parse and write Data in
InfluxDB you have to use the line protocol! The InfluxDB line protocol
is a text based format for writing points to the database. A single line
of text in line protocol format represents one data point in InfluxDB.
It informs InfluxDB of the point’s measurement, tag set, field set, and
timestamp. Tag set and timestamp are optional. It is important that the
spaces and commas are set correctly!
Syntax: <measurement>[,<tag_key>=<tag_value>[,<tag_key>=<tag_value>]]<field_key>=<field_value>[,<field_key>=<field_value>][<timestamp>]
Example: h2o_feet,location=freiburg water_level=4
In our example we use a measurement called "h20_feet". The measurement
has one tag key (location) which has one tag values: freiburg.
"water_level" is our field_key which stores float field values in the
"mydb" database.
Finally you have to add the "Json" Parameter with FALSE as value.
That`s it!
Write Data in InfluxDB with the REQUEST function
Query Data:
To Query Data we use the HTTP.REQUEST function with the GET Method and
write the query into the URL. There are plenty ways to query your
Data. You can have a look at them
here.
In our simple example we query all data of the last minute from our
h2o_feet measurement.
URL: http://influxdb:8086/query?db=<Database name>&q=<your query>
Example URL: http://influxdb:8086/query?db=mydb&q=SELECT FROM "h2o_feet" WHERE time > now() - 1m*
That's it! Now you receive the Data in your payload. It`s time to process the Data in this or another Streamsheet!
MAIL.SEND
In This Tutorial we will send E-Mails to a Mail Account from our Streamsheet, using an SMTP Client.
First, create an SMTP_Connector. Therefore, click on the Administration Menu and navigate to Connectors to create a new Connector, with a “SMTP Provider”. To be able to use the SMTP Connector, the Host-address, the Port and the Security Protocol of the Mail Service that is used, needs to be typed in. For example the host-address for Gmail is “smtp.gmail.com”, the Port is 465 and the Security is SSL/TLS. (This may differ from other Mail-Services, their access data can be found on the internet)
For the next Step change to Producer and create a new Producer, using the previously created Connector. Now enter the sender mail address as Username and add the password below.
Even if the whole Setup is correct, there is a high chance that it will fail! For instance Gmail is blocking the access of this app, because it’s using a “low” security level. To give Streamsheets access to Gmail, enable “allow low security applications” manually on the Gmail website. After that the Connector and the Producer should be connected!
Now we are ready to switch to a Streamsheet. To insert the MAIL.SEND function in the Streamsheet, use the Function Wizard and select “MAIL.SEND” as the function and the previously created Producer as Stream. For “Text, Subject, TO” etc. either type it in directly or refer to a cell on the sheet. That`s it!
To prevent spam we recommend adding a condition to the MAIL.SEND function 😄
Sending mail`s with a condition
Note: In version 1.5 the icon for the stream functions was changed
![]()