Timeseries Functions
Often it is important to not only work with single real-time data points in the moment, but to build a history and work with a series of values. In the Chart section we discussed ways of data representation, but we have not discussed how to gather this data in Eclipse Streamsheets and how realtime updates work. The following solutions are perfectly helpful in situations, where permanent data storage is not neccessary. To permanantly save your data connect Streamsheets to a database like MongoDB, InfluxDB or TimescaleDB.
Timeseries data table
In an IoT environment it is essential to work with dynamic sets of data. The maybe most obviouse way to create a table, that dynamicaly updates overtime and uses messages from Streams to add information, is to use direct cell refernces. The following example shows how to create a short (stepwise) data history.
Every Streamsheet is calculated from left to right and from top to bottom. Consequently, cell A1 is calculated first followed by B1, C1 etc. proceding in the next rows in the same manner. Thanks to this concept, we can use references to create a history of values.
The cell at the very bottom references to the data input and the cells above the reference to the cell below. As higher cells are calculated first, they fetch the values of lower cells before these are calculated. In the end the last cells take the latest data input. Effectively it looks as if new values enter the history at the bottom and move up before leaving the series at the top.
Create data history in a Streamsheet
Timeseries functions
Using table in sheets feels natural, but holding huge chunks of data on a Streamsheet is not always the best decsion (especially if you don´t want to display the whole table and only use it as a base for charts). Tables cover a lot of space, which should be used for implementing your logic. This is where timeseries functions come into play.
These functions track a cell and store the observed changes & timestamps over a certain amount of time. They basically create an invisible table fitted into one cell. The result is, that now Charts can use one function as a data range instead of huge tables. While the TIMESTORE function is used as a base for one or more TIMEQUERY functions, the TIMEAGGREGATE works on its own.
TIMESTORE & TIMEQUERY: TIMESTORE and TIMEQUERY operate like a short term database. The TIMESTORE function saves key value pairs over a specified period of time. Like a real databse, it creates a data table, which then again can be queried by the TIMEQUERY function. It is possible to not only query original values, but aggregate and filter the data. You can add one or more TIMESTORE function per Streamsheet and every TIMESTORE can be referenced by one or more TIMEQUERY function.

Storing the key value pairs of Berlin, London and Paris

Adding queries on top of the TIMESTORE()
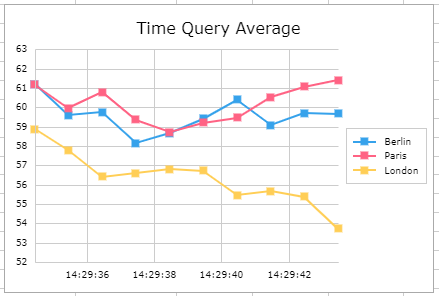
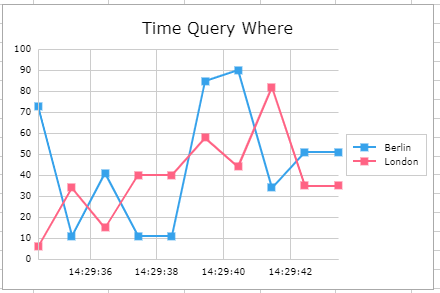
Adding charts on top of the TIMEQUERY functions
TIMEAGGREGATE: The TIMEAGGREAGATE function is the quick hack of TIMESTORE and TIMEQUERY. It monitors one key value pair over a specifed time. As the TIMESTORE function it stores the raw values and timestamps within the cell, while displaying the aggregated value as the cell value.

TIMEAGGREGATE(B6,,4) uses B6 as the datasource and is set to method "4"
which determins the maximum of all recieved values. To display the
aggregated value reference it again in another cell (Max 122).
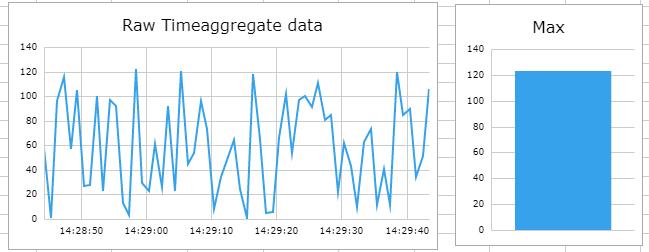
Now you can use the cell of the TIMEAGGREGATE() function to display the
raw data chart and the reference cell for the aggregation.
To create a chart with more then one data series just use multiple TIMEAGGREGATE() or TIMEQUERY() functions as the soure range.
#LIMIT appears, when the set limit of stored key value pairs is reached. This is not necessarily a problem, it only means that old stores will be overwritten by newer ones.