Streamsheet
Streamsheets are the main components to create the logic for your use cases. Here you model how an App works and, thus, how data streams are processed, analyzed, visualized, combined and controlled or even simulated.
To connect a data stream to a Streamsheet you can:
- Select a onsumer (This is the most common case; however, a Consumer must be created in the administration first)
- Use specific functions, e.g. OPCUA.READ or HTTP.REQUEST with GET-Method
To create an outgoing data stream or make data available you have several options:
- Choose a Producer function, e.g. MQTT.PUBLISH or KAFKA.PUBLISH
- Choose a posting function, e.g. OPCUA.WRITE or HTTP.REQUEST with POST-Method
- Expose the App as OPC UA or REST Server so that other services can access its data
- Store the data in a database, e.g. by using TIMESCALE.INSERT
Often, a Streamsheet consumes and produces streams. Nonetheless, neither an incoming nor an outgoing data stream are mandatory. For instance, Streamsheets which are calculated repeatedly and only produce streams are great for simulating sensors, machines, APIs and other data sources. On the other hand, sheets with pure dashboard and visualization functionality typically only consume streams without generating one on their own.
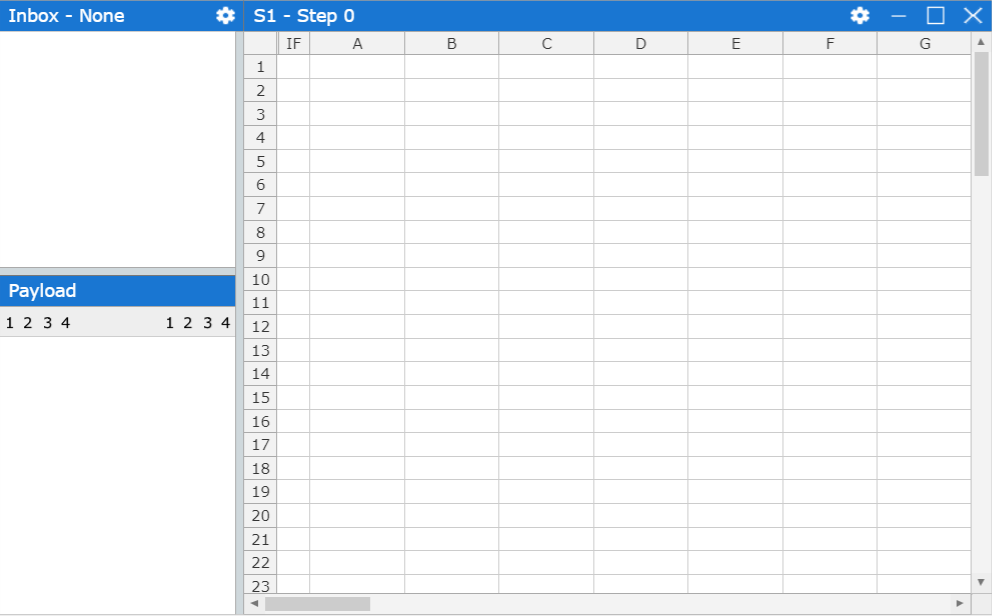
Each Streamsheet consists of an Inbox and a Grid.
Inbox
As in a mail service, the Inbox marks the point where new messages arrive and queue in order of their arrival time before they are processed. Although the Inbox only displays up to a maximum of 100 messages on your client (your browser), an unlimited amount can be queued on the server. The structure and content of a message is given in full detail and presented as a JSON Object in the Payload section. Should the original data format not be JSON, the format is automatically converted. Via drag and drop some or all payload elements of incoming messages can be linked to the grid and create a READ() function. Now, every time a new message arrives and the Streamsheet is calculated, the respective cells are updated with new message data or set to #NA, if a message did not deliver the linked parameter. Message streams are connected to a Streamsheet by selecting a Consumer in the Inbox Settings. The name of the selected Consumer is then also shown above the Inbox. Consumers define incoming data streams (More on them under Consumers).
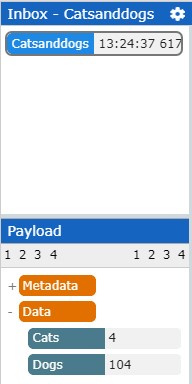
The inbox above holds two messages. The first has the Message-IDs HJFG5rEDV and holds one data element as content, a temperature measurement.
Inbox Settings
In this settings menu you decide which data streams a Streamsheet consumes and also its recalculation mode. The settings explained point by point:
“Consumer” lists all available Consumers. Choose the one which delivers the desired data streams. To define new or adjust existing Consumers, please go to the Administration Menu.
“Calculate Streamsheet” defines the recalculation mode of a Streamsheet:
- “Continuously”: The Streamsheet is recalculated continuously and cyclically until the App is stopped - also if NO messages are received. The sheet´s cycle time is the cycle time of the App. (This is the default setting)
- “On Message Arrival”: Every time a message is received, the sheet is calculated immediately. In this mode message queues are not formed because the sheet is recalculated irrespective of the cycle time of the App.
- “On EXECUTE Formula”: The calculation of a Streamsheet is triggered by another Streamsheet which contains an EXECUTE formula. This triggering sheet must be in the same App. Note: The sheet triggering the execution will pause its calculation in the cell containing EXECUTE, wait until the triggered sheet has completed its calculation and, then, resume its calculation.
- “On App Start”: The Streamsheet calculates once when the App is started.
- “On App Stop”: The Streamsheet calculates when the App is being stopped.
- “On Time”: A date and time for the calculation can be defined. Additionally, a sheet-specific interval can be set to recalculate the sheet cyclically. This interval only applies to this sheet and overwrites the cycle time of its App.
- “On Random”: A date and time for the calculation and additionally an interval for the recalculation can be defined. In this respect it is similar to “On Time”, however, the calculation will not be triggered at the beginning of each interval but randomly during the interval. This mode provides a way for introducing randomness, which can be interesting when simulating data sources, for instance.
Loop through array (one calculation per array element): This comes in handy if your messages contain information through which you want to loop, e.g. a list of ordered products. If this option is checked, an array element within incoming messages can be selected. Then, the Streamsheet loops through all elements which are subsumed under this array element. As a result, not one message per calculation is processed but only one element under the array element. The easiest way to set a loop element is to right-click on it in the inbox-payload and choose this option. Alternatively, you can define it and its superelement by listing the respective keys.
„Hide unprocessed Messages”: If this option is checked, a queue of messages is not displayed in the inbox. Only the next message to be processed is displayed.
A Consumer delivers messages to a Streamsheet. Via drag & drop the content of messages can be linked to the Streamsheet grid. A Producer can be used to send messages from a Streamsheet to a destination. Check out "Getting Started" to learn more.
Grid
The grid of a Streamsheet is the place where the logic for analysing, processing and visualizing data is modelled. This is done by using spreadsheet functions and the tools you find in the tool bar. Streamsheets offer familiar spreadsheet formulas, as e.g. known from MS Excel or Google Sheets, as well as formulas especially designed for working with data streams and dynamic data structures. All formulas are explained in detail in the functions section. The recalculation of a Streamsheet can be triggered in various ways, e.g. always when a new message arrives, at specific points in time or cyclically. (Jump to Inbox Settings to see all calculation modes) However when a Streamsheet is calculated, this always happens cell by cell from left to right and from top to bottom thus maximizing transparency over what is happening in which order. Special columns
- IF-Column: This is the first column right before “A”. Cells in this column take conditions and based on the state of these conditions, the respective rows are being calculated or not. As a result, IF-cells switch the calculation of entire rows and their cells on and off. The default value of IF-cells is TRUE. Thus, if IF-cells are empty, the rows are calculated.
- COMMENT-Column: Even further to the left of the IF-column is the COMMENT column which is hidden by default. This column is intended for documenting what your model does.
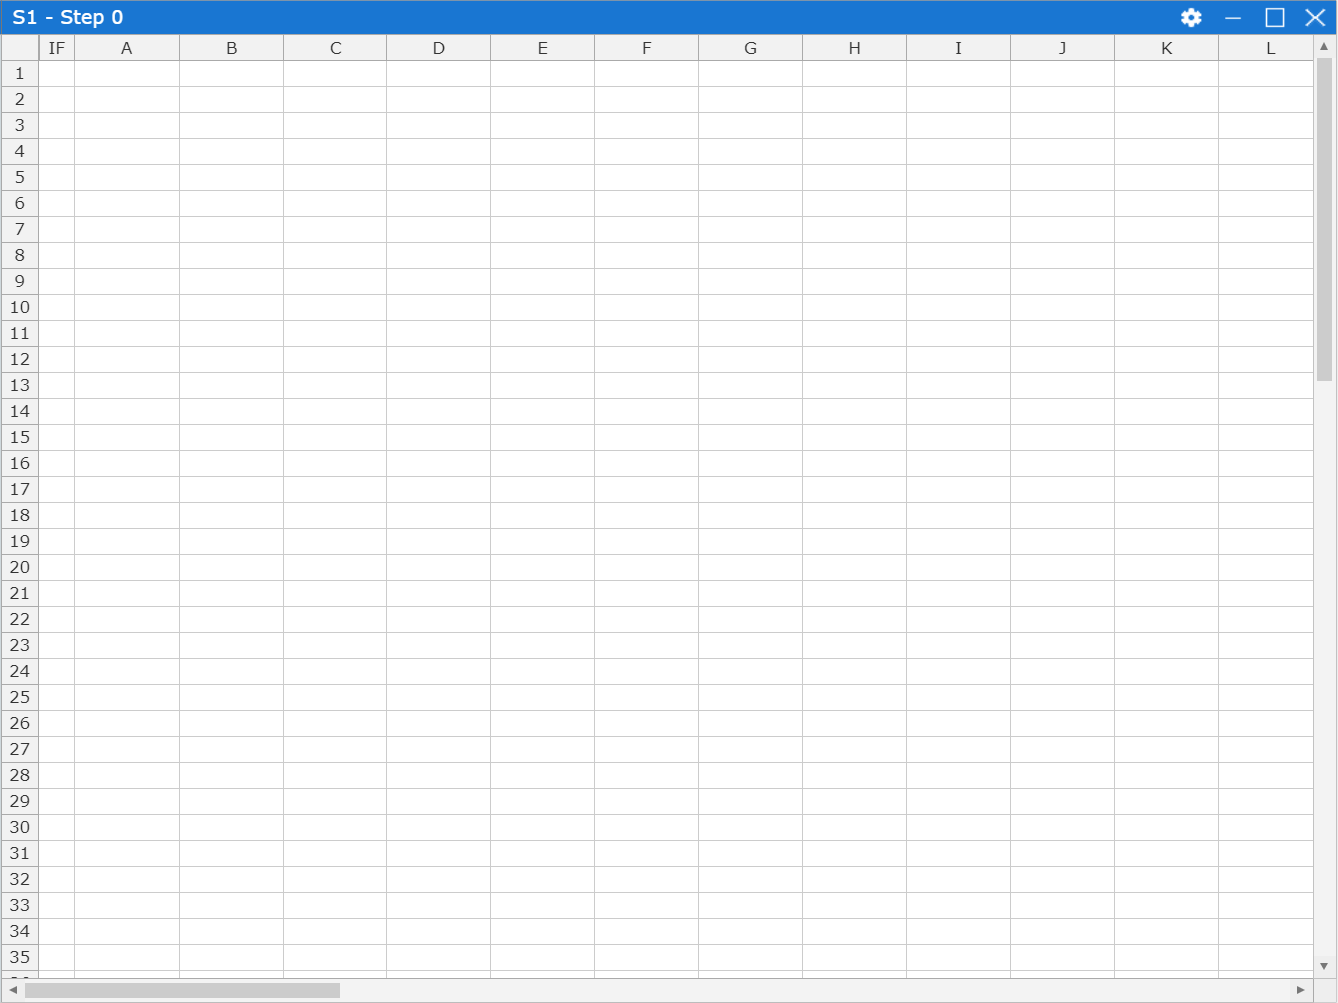
In the left corner above the grid, the name of the Streamsheet is given and how many times it has been calculated since the last App stop (Note: Pausing an App will not reset the Step Counter). On the right, you can maximize, minimize and delete a sheet or open its settings.
Streamsheets Settings
In this menu you find the settings for the basic structure and appearance of a Streamsheet.
Settings:
- Name: A Streamsheet can be renamed.
- Columns: Set the number of columns (Max: 50)
- Rows: Set the number of rows (Max: 200)
- Protect sheet: No interaction with grid or the Inbox is possible
- Show Grid: Display the grid or do not
- Show Headers: Display column and row titles or do not
- Show Formulas: Decide whether you want to see the formulas or the current values of cells in the sheet.
- Show Inbox: Display the Inbox or do not
- Paint IF Rows with transparency: If this box is checked, the content of rows which contain a statement in the IF-column are transparent. This improves transparency and helps you to immediately identify the rows which are being switch on and off when the App is running.
- Streamsheets are always calculated from left to right and from top to bottom.
- Depending on a condition in the IF column, the calculation of whole rows can be switched on and off.
Messages
In the Streamsheet environment, all messages are JSON objects. In case the original data format is not JSON, but e.g. csv, xml or a text file, the format is automatically converted to JSON.
JSON
- Json objects are a hierarchy of key-value pairs. This means that any value, e.g. a number or a string, is identified by its key. You could think of the key as the name or the title of its value. In order not to just have a flat list of key-value pairs, these can be ordered and subsumed, e.g. in the Inbox picture the key-value pair “Temperature: 34” is subsumed under the top-element “Data”.
Connect message content to the Grid
- To link data elements of an incoming stream to the grid, simply drag-and-drop the respective elements. You can also link all elements under a top-element at once by drag-and-dropping their top-element. If you hit Strg or Cmd while you are doing this, the drag-and-drop range turns by 90°.
- Of course, Streamsheets offer the possibility to use a function to read incoming data. This function is called READ and it is also automatically created when you drag-and-drop elements into the sheet.
Generate message content aka a JSON object in the sheet
In order to send data, you need to create a JSON object and then use a producer or posting function.
- You can convert any coherent cell range consisting of two columns and an arbitrary number of rows into a JSON object. Simply select the range, then, right-click it and choose “Define JSON Range”. This generates a flat JSON object, that is to say that all keys are in the first column, the respective values are in the second column and the object is not hierarchically structured. To build a hierarchy, select the elements you want to subsume and hit “tab” on your keyboard. If you want to undo this operation, just hit “tab” and “shift” at the same time.
- If you turn more than 2 columns into a single JSON range, the first column will contain the keys whereas the remaining columns accommodate the values. Example: A range of 4 columns is turned into a JSON range. The first column contains the keys which all value-columns will share. Each value-column will automatically assume the keys in the first column to build key-value pairs.
- To send messages or make JSON ranges available choose one of the ways mentioned under Streamsheets