App
= premium feature
Eclipse Streamsheets are bundled in one functional entity which processes data streams, an App. The behavior of an App and the way it processes data streams is defined through its Streamsheets. All Apps are listed in the “Dashboard”. You can access the Dashboard by opening the burger menu in the top-left corner and selecting "Apps" towards the end of the list. The Dashboard is also the start screen.
App Characteristics
- Apps contain one or up to four Streamsheets.
- Apps run on servers. Hence, once you start them, they keep running until they are being stopped or the server is shut down. That means you can close your web browser and the App is still running. It even means you can turn off the device you are using to access the Streamsheet platform, e.g. your computer, and the Apps keep running.
- Apps have a cycle time. This serves as its general calculation speed and could be seen as its internal clock.
- Each App is a microservice.
Menu & Settings
At the top of every App you find the menu bar containing its name, controls and cycle time. To access further App settings, click on the burger menu in the top left corner and then click on “Settings”.

Name
To better organize all of your Apps you should think about a
comprehensible name names (it can be more descriptive as in the example
😉 ). 
App Control

With these 4 buttons an App\s state is controlled. An App can either be started, paused, stopped or calculated step-by-step.
- Stop: This button stops the App and sets its calculation-step-count to 0. Additionally, the step-counts and the inbox queues of its Streamsheets are reset.
- Pause: This pauses the App. Step-counts are not reset. However, the biggest difference to “stop” is that messages are queued in the inboxes of the Streamsheets.
- Play: This button starts an App if it is paused or stopped. Message streams are only processed or produced if an App is set to “play”.
- Execute 1 step: Clicking this button triggers one App calculation step.
Cycle Time
When an App is started, it recalculates continuously at the speed of its cycle time. This affects every Sheet with the calculation mode set to "continuously".

Depending on how fast an App is running, not every recalculation-step can be visualized in your browser. Thus, the system automatically balances itself by visualizing only every Xth step. In addition, this update interval can also be set to a higher value manually. In any case, this affects only the visualization in the browser as the App will always run with the defined cycle time on the server.
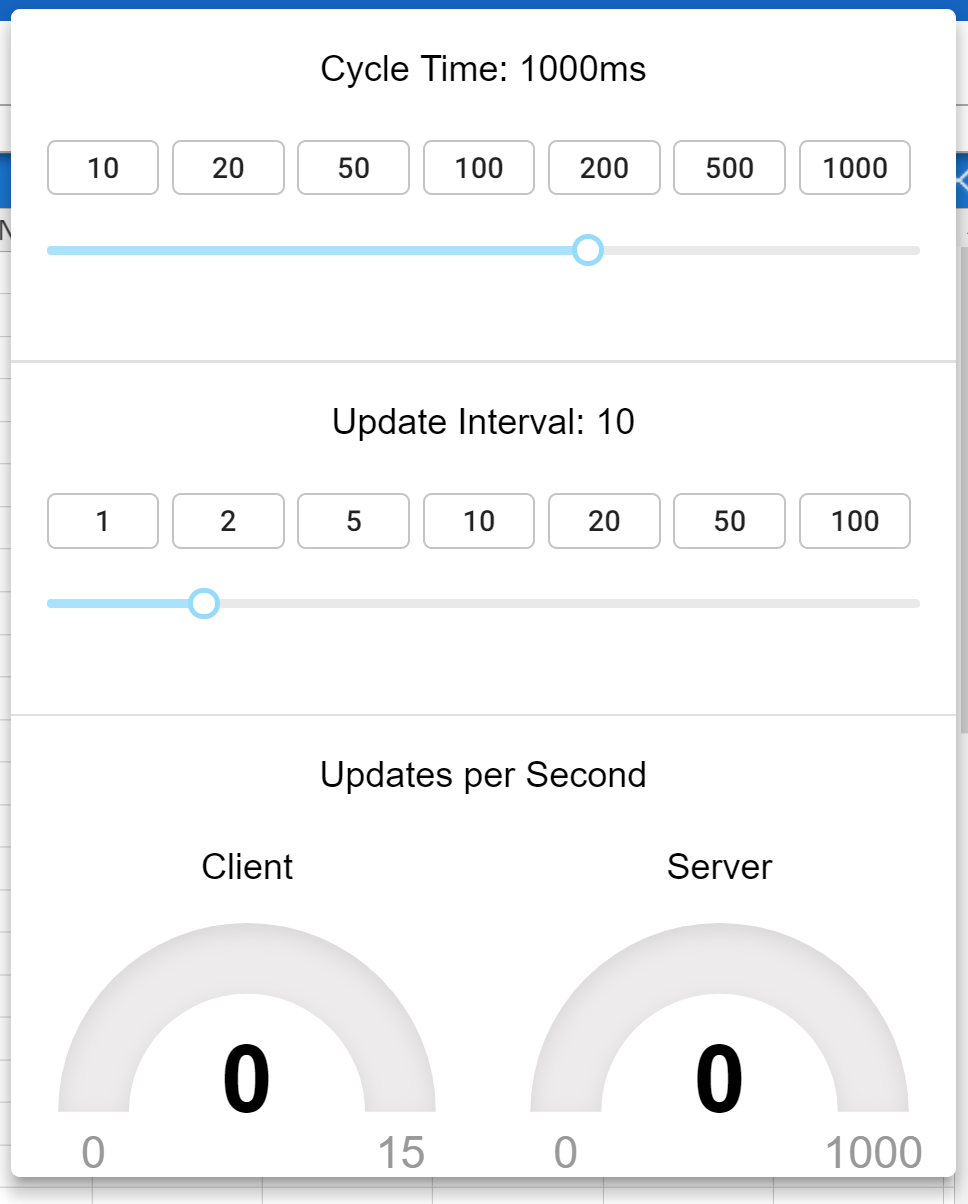
In the screenshot the cycle time is set to 1000 ms. Thus, the App performs one recalculation aka one step per second. The Update Interval is set to 10. Consequently, the visualization of the App and its Streamsheets is updated in your browser only every 10th step that is to say in this case every 10 seconds. The gauges show how many steps are calculated on the server and how many are visualized on the client (your browser).
Some Calculation Settings in the Stream Sheet Settings ignore the cycle time.
Tool bar

Here you find many tools to insert functions, shapes and charts as well as to format cells in the Streamsheet grid.
Tools especially worth mentioning are:
- Insert Stream Function: This tool opens a wizard containing all functions you can use to save and send data, essentially to produce a data stream. Most of the functions serve the purpose of creating an outgoing data stream. However, some, such as HTTP.REQUEST or MONGO.QUERY, can also be used to bring data into the Streamsheet. Simply choose a stream function and complete the arguments. The default option is called MQTT.PUBLISH. This is also the most common formula to send data from one App to another.
- Insert Drawing Shape: This tool offers you a variety of shapes to use in your Streamsheets. Insert a shape and have a look at the formula bar. You will see that every shape is created by a DRAW formula. Link the position parameters to cells with changing numbers and the shape starts moving.
- Insert Chart: Similarly to other Spreadsheet solutions, charts can be created by selecting a cell range and choosing a chart type. However, as Streamsheets are recalculated automatically, charts change dynamically according to their input.
Side menu
The side menu offers quick access to a bunch of different options. The side menu differs depending on if you are using the OS or the premium version of Streamsheets.

You are able to create another "new" app or "open" an existing one. It is further possible to create a "copy" of your current version of your app or simply "delete" it. Moreover you can access the "export" menu or "import" existing apps. The premium version also offers a "PDF export" of your current view.
App Files
If you have used functions like TIMESCALE.EXPORT(), you are able to access the exported files under "App files".

Share App
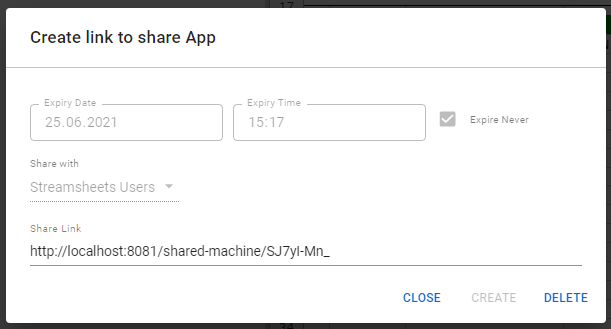
The "Share App" option allows to administer direct access to your app for external or internal user. It creates a shareable URL to your app in the preview mode setup.
Set your prefered time frame and who to share the URL with.
HTTP Server
Your app is able to be accessed via HTTP requests. Enable the HTTP Server endpoint for your app and allow requests to appear in a dedicated inbox.
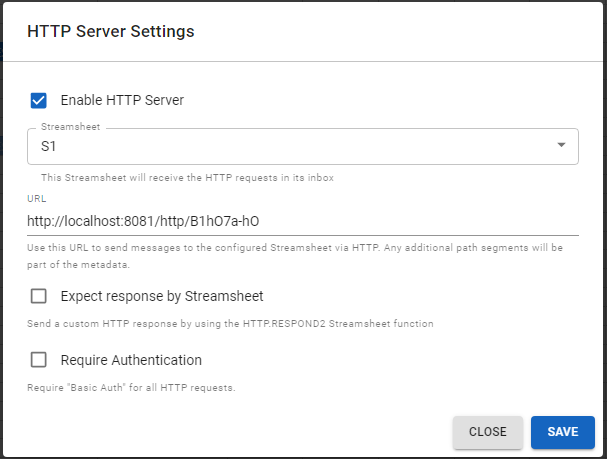
Use the given URL to send the request. If you checked "Expect response by Streamsheet" the request will still be delivered to the configured inbox, but will need a HTTP.RESPONSE() function to send a response. If not, the server will respond with a timeout message. Un check this option to automatically send a response.
If needed, add basic authorization for your server.
Webhook Server
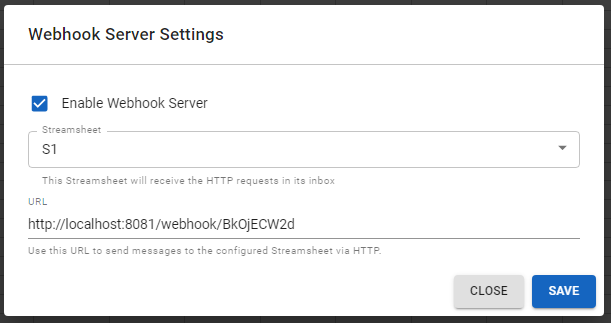
The OS version does not include a fully functional HTTP server. You are still able to send requests to your app, allowing the implementation of webhooks.
Settings
In the app settings it is possible to set the language. This is important to define the used "seperators" and the numberformat styling. It is further possible to declare an onload sheet to be maximized.
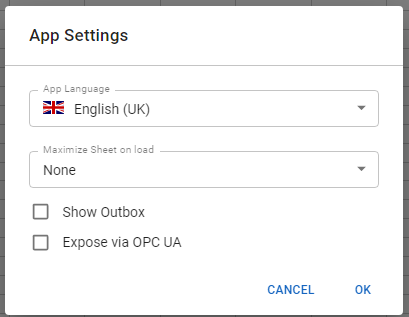
The premium version supports the usage of OPC UA. To allow the app to host OPC UA nodes, check the "expose" box and use OPCUA.VARIABLES() within the sheet.
Preview
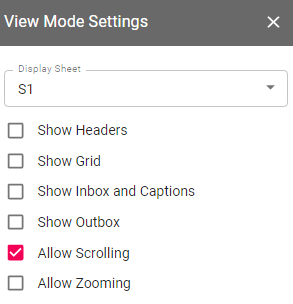
The Preview allows to view the app in full screen mode and hides the toolbar. There are multiple settings to play around with.
