Audit Trail Settings
The audit trail is defined as a tool to track interaction with the Cedalo MQTT Platform. To do this at least one logger must be set up and added to the audit trail. The platform categories each interaction into a create, read, update or delete (CRUD) operation which then gets logged.
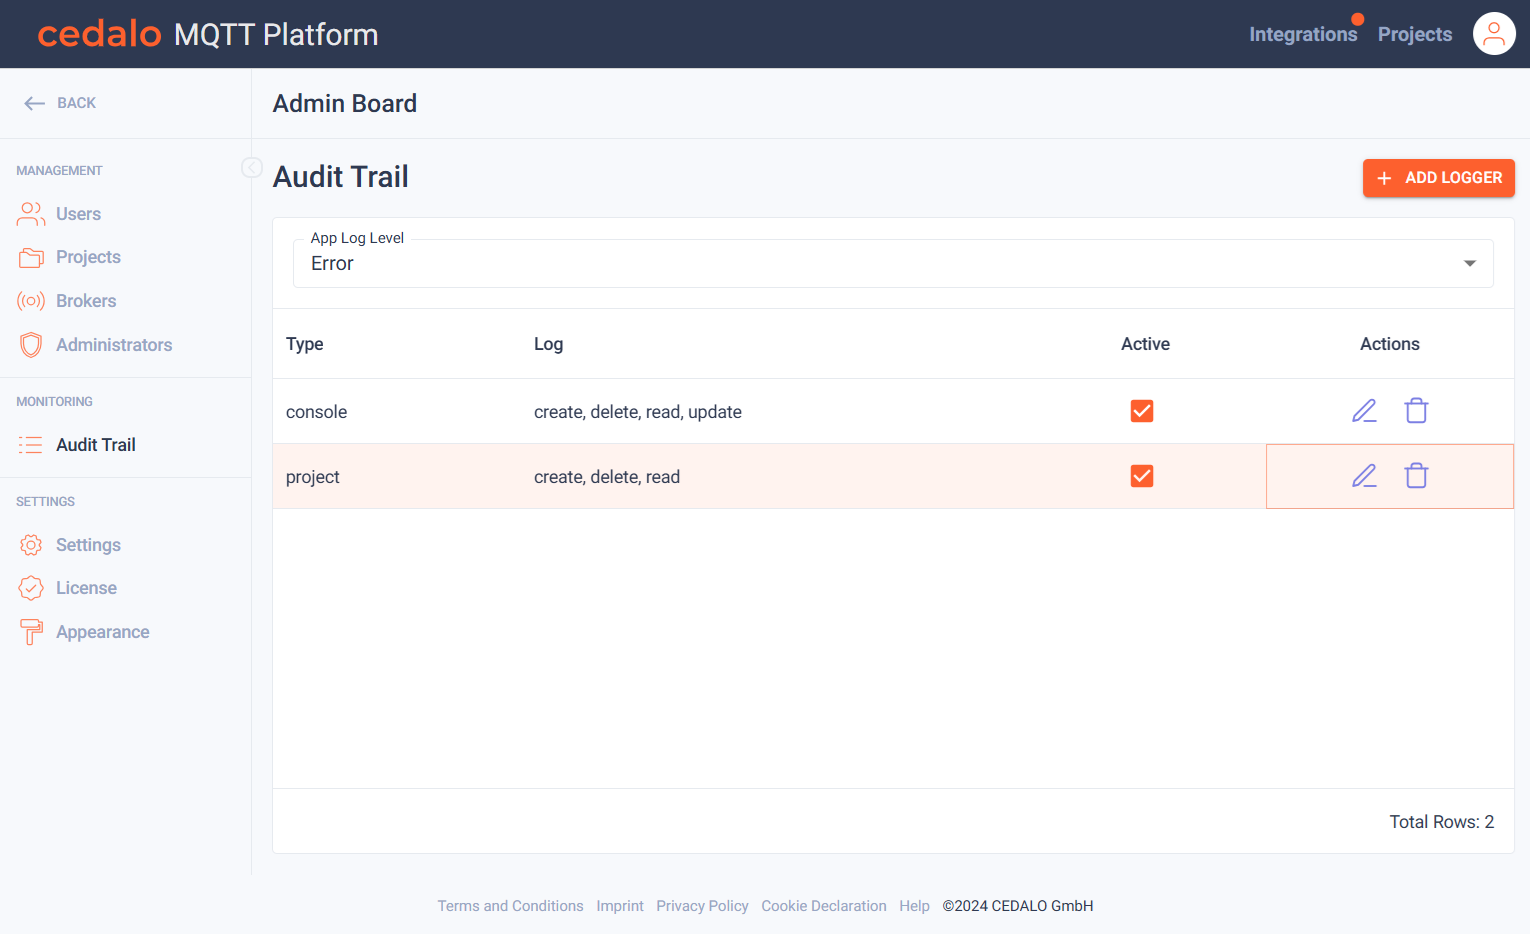
App Log Level
This setting defines the platform-wide log level. Each operation must have at least this log level in order to be logged. The available log levels conform to the standard syslog log levels as defined in RFC 5424 and are as follows (in order of priority):
- Emergency: system is unusable
- Alert: action must be taken immediately
- Critical: critical conditions
- Error: error conditions
- Warning: warning conditions
- Notice: normal but significant condition
- Info: informational messages
- Debug: debug-level messages
That means an app log level of (e.g.) 'Warning' will log all operations with a log level of 'Warning', 'Error', 'Critical', 'Alert' and 'Emergency'.
If an operation results in an error this operation will always be logged with an 'Error' log level.
Overview of existing loggers
The list of currently added loggers are shown in the table below the App Log Level. Here you can see the type or target of the logger, which operation(s) the logger is recording and if the logger is active. You can also edit or remove the logger of a row. The following image shows a sample list with two loggers. The type and log values are described below.

Adding a new logger
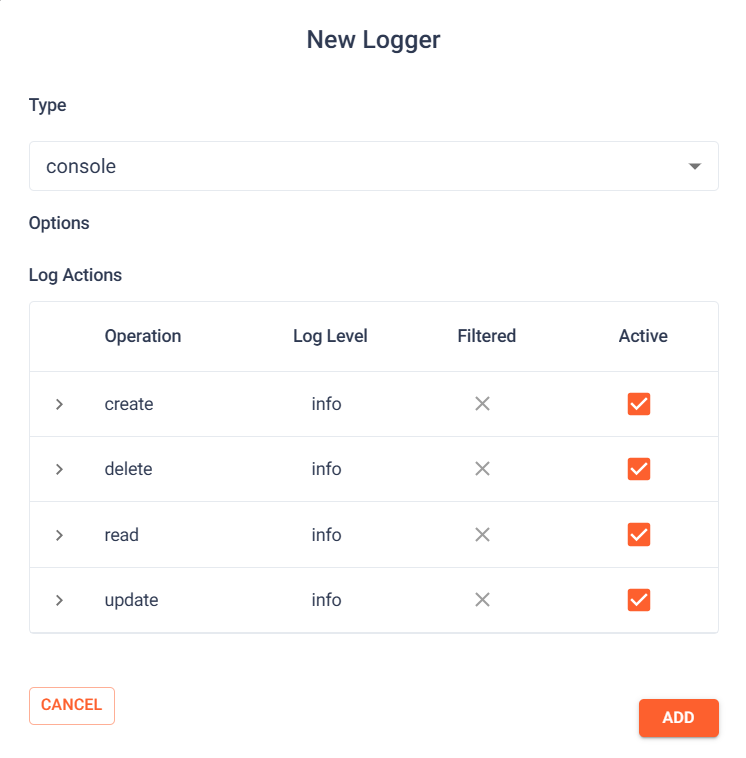
A new logger can be added by clicking on "Add Logger" at the top right of the page. Then the following dialog will open to present a list of available loggers to choose from and a set of options to set up selected logger.

Following loggers are available:
Type
- console: the logger info will be output to your service console
- file: the logger info will be written to a file
- project: the logger info will be stored in memory and can be viewed in the project settings
- syslog: the logger will use a syslog target, that has to be specified by the options below
console
Logs directly to the platform service console for quick and accessible monitoring.
file
Specifies the file and its location where audit trail information will be output. Make sure the choosen file path is available and the Cedalo Platform has writing access to the specified file.
project
This option enables logging of actions on a per-project basis. By enabling this feature, you allow project members to view the configured audit trail logs within the project settings of each project. Add this logger if you wish to monitor and review logs directly from the project settings.
syslog
- host: 'The host running syslogd, defaults to localhost.',
- port: "The port on the host that syslog is running on, defaults to syslogd's default port.",
- protocol: 'The network protocol to log over (e.g. tcp4, udp4, tls4, unix, unix-connect, etc), defaults to udp4.',
- protocolOptions: 'Socket connect options. See net.socket.connect for available options.',
- path: 'The path to the syslog dgram socket (i.e. /dev/log or /var/run/syslog for OS X).',
- pid: 'PID of the process that log messages are coming from (Default process.pid).',
- facility: 'Syslog facility to use (Default: local0).',
- localhost: 'Host to indicate that log messages are coming from (Default: localhost).',
- type: "The type of the syslog protocol to use (Default: BSD, also valid: '3164', '5424', 'RFC3164' or 'RFC5424').",
- app_name: 'The name of the application (Default: process.title).',
- eol: 'The end of line character to be added to the end of the message (Default: Message without modifications).',
- secureProtocol: 'See //nodejs.org/api/tls.html#tlscreatesecurecontextoptions for more information on this option, passed through from this constructor.',
- ciphers: 'See https://nodejs.org/api/tls.html#tlscreatesecurecontextoptions for more information on this option, passed through from this constructor.',
- ecdhCurve: 'See https://nodejs.org/api/tls.html#tlscreatesecurecontextoptions for more information on this option, passed through from this constructor.',
- rejectUnauthorized: 'See //nodejs.org/api/tls.html#new-tlstlssocketsocket-options for more information on this option, passed through from this constructor.',
- requestCert: 'https://nodejs.org/api/tls.html#new-tlstlssocketsocket-options for more information on this option, passed through from this constructor.',
Options
Depend on the logger type choosen.
Log Actions
Each interaction with the platform is categorized into following four log operations:
- create: log, if a new item is created
- read: log if an item is read from the repository
- update: log if an item is changed and saved to the repository
- delete: log if an item is deleted from the repository
Any of these operations can be activated for logging or deactivated by clicking the respective checkbox. To reflect the importance of an operation the log level is used to prioritize it. 'Debug' is defined as the lowest priority and 'Emergency' as the highest. The other according to their position in between.
To log an operation its log level must be equal or higher as the currently used app log level.
Finally, one or more filters can be applied to an operation. The following settings are applicable:
- Type: 'include' or 'exclude' an operation based on the filter
- Use On: This defines, where the filter is applied on. Here you can choose between the 'Request Path', the 'Username' or the 'E-mail' address. The 'Request Path' relates to the endpoint URL of a REST Api request.
- Value: This is the filter expression that matched against the 'Use On' string.
*can be used as a wildcard inside the filter expression
If needed, multiple filters can be defined per operation. Use the buttons right next to the filter to add or delete one.
View or track audit trail logs
The audit trail can be viewed depending on the logger type:
- console : observe your service console output
- file : open the file, you defined, when adding the logger
- project : navigate to project settings and then to audit trail
- syslog : open the syslog on the host, port regarding all option you defined, when creating the logger.