Shapes
In some scenarios it is necessary, to not only control data streams and implement certain logic, but create dashboards to present the data to an end user. Besides visualizing data in charts, a dashboard can be composed of different shapes and interactive objects to create a complete user experience.
Creating Shapes
To create a shape, you simply have to select one of the two buttons within the toolbar listing all shapes or all charts. A list of all available shapes or charts is opened.

Then you click on the sheet and drag the mouse to position the shape. If you just click on the sheet, a shape with a default size will be created.
Working with Shapes
You select a shape by simply clicking on it. Using the Ctrl-key, you can create a multi-selection.
The arrow button ![]() in the toolbar allows to define a region with the mouse to select shapes within.
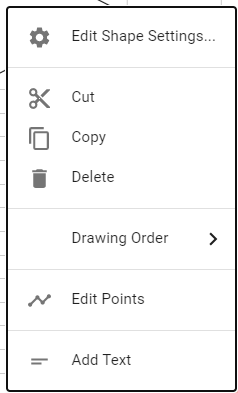
Once selected, you can use the right mouse button to show context menu with several options:
in the toolbar allows to define a region with the mouse to select shapes within.
Once selected, you can use the right mouse button to show context menu with several options:
- Edit Shapes Settings (also double-click on shape)
- Cut, Copy and Delete (also available via keyboard)
- Change the drawing order of shapes
- Edit Points, if it is a polyline, polygon or bezier
- Add Text to a shape (except for charts)
- Align Shapes (if a multi-selection is present)
Using the selection points, you can rotate or resize the shapes. Ctrl-Move will create a copy of a shape and start moving it. Shift-Move will move the shape vertically or horizontally.
Edit Points
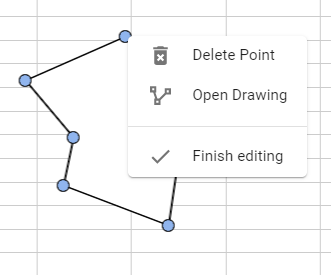
If you activate the "Edit Points" mode using the context menu for a polyline or bezier, you have the following options:
- Move a point by clicking on the point and moving it
- Insert a point by clicking on a line between points and moving the new point to the desired location
- Right-click on a point to open a context menu like shown below. You can delete a point, close the shape or leave the editor
You can also close the "Edit Points" mode by clicking outside the shape into the sheet. Be aware that modifying a shape, that retrieves its coordinates from a cell range is not accepted.
Shape Types
There are simple shapes like lines, rectangles, circles and similar. In addition, interactive shapes are offered. These allow some interactivity like a button or slider. Charts are also shapes. These shapes are explained in more detail in the following sections.