App
The content of an app sheet is the heart of Streamsheets and the place where the no-code magic begins.
On the first glimpse, it looks very much like a regular spreadsheet page, but have a closer look, there are some additions, which allow for the static spreadsheet character to transform into a dynamic Streamsheet.

Let's start with the basics:
All general spreadsheet apps contain one or up to six sheets, with a maximum of one sheet being a dashboard.
Streamsheet apps run on a server. Hence, once you start them, they keep running until they are stopped or the server is shut down. That means you can close your web browser and the App is still running It can be accessed over your network or even the web at any time from any device.
Sheets need a trigger for recalculation. By default, they are set to an interval trigger of one second. Go to the inbox settings to adjust the trigger.
There is a dashboard sheet. If you are not only adding logic but need to display your creations in the form of a website, use a dashboard sheet. You can even add user interactions.
Steps and calculation process
In the top bar, the name of your App and the current status are displayed. Only “running” applications will calculate. This is also indicated by the step counter in the bottom right corner of each sheet. The moment the step counter of a sheet increments, the whole sheet is calculated once.
Sheet Calculation
A calculation process starts in the top left corner of the grid in the IF1 cell, moving the calculation process further to A1, B1, etc. When all cells in the first row are processed, the calculation moves to row two. This is repeated until all cells are processed. The sheet waits for the next trigger to start the calculation process again.
There can be multiple kinds of triggers, which can be set in the inbox settings of each sheet. So every sheet can run on a different trigger, depending on the needs of your logic.
App control
Right below the displayed status, you can find the status control. Possible states are:
- Play: The application is active and all triggers will immediately lead to a sheet calculation. All inbox connections are active.
- Pause: The application is paused. The inbox of every sheet is still active and awaits possible messages, but no trigger will be processed. In the state of Pause, it is further possible to trigger one step at a time. This is usually helpful in testing and debugging situations. Queued messages will be processed.
- Stop: The application is stopped. No inbox connections are active and all queued messages are cleared.
Streamsheet
The Streamsheet is the main component to create the logic for your use cases. Here you model how an App works and, thus, how data streams are processed, analyzed, visualized, combined and controlled, or even simulated.
The process of recalculation described above always refers to the logic implemented on the grid.
You can add up to six sheets to one application, with a maximum of one being able to be a dashboard sheet. A dashboard allows easy placement of objects, widgets, and charts to create a dynamic webpage.
Sheet
The sheet or grid of a Streamsheet is the place where the logic for analyzing, processing, and visualizing data is modeled. This is done by using spreadsheet functions and the tools you find in the toolbar. Streamsheets offer familiar spreadsheet formulas, e.g. known from MS Excel or Google Sheets, as well as formulas specially designed for working with data streams and dynamic data structures. All formulas are explained in detail in the functions section. While typing, the inline help supports your search for the right function.
In the bottom bar, you can add further sheets or a dashboard sheet and switch between them. On the right side of the grid, the step counter indicates the number of calculations done since the App was started.
Toolbar
The toolbar is a fast access menu for different utensils. These all have a direct influence on the currently selected Streamsheet.

- Inbox Settings: Access a sheets inbox settings.
- Zoom: Set the zoom of a sheet. You can either use the zoom tool or use your mouse scrolling + the ”ctrl” key for zooming.
- Undo/Redo: Traces your changes and lets you go back. Only works in an open tab and is not saved after closing.
- Formatting tools: Several different formatting options for the selected cell(s) and shape(s).
- Reference dependency discovery tool: Select a cell and choose references to and from this cell, to get a quick overview of dependencies.
- Shapes: Choose between a variety of shapes to insert into a sheet.
- Charts: Select from a variety of charts to display various context.
- Sheet Settings: Access the settings for the currently focused sheet.
- Split View: Allows to toggle between one and two displayed sheets at the same time.
Inbox
As in a mail service, the Inbox marks the point where new messages arrive and queue in order of their arrival time before they are processed. Although the inbox only displays up to a maximum of 100 messages on your client (your browser), an unlimited amount can be queued on the server. The structure and content of a message are given in full detail and presented as a JSON object in the payload section. Should the original data format not be JSON, the format is automatically converted to a string. Learn more about the Inbox here.
Connections
The “Connections” menu can be accessed either via an inbox or directly via the connection icon in the top right corner of your App.
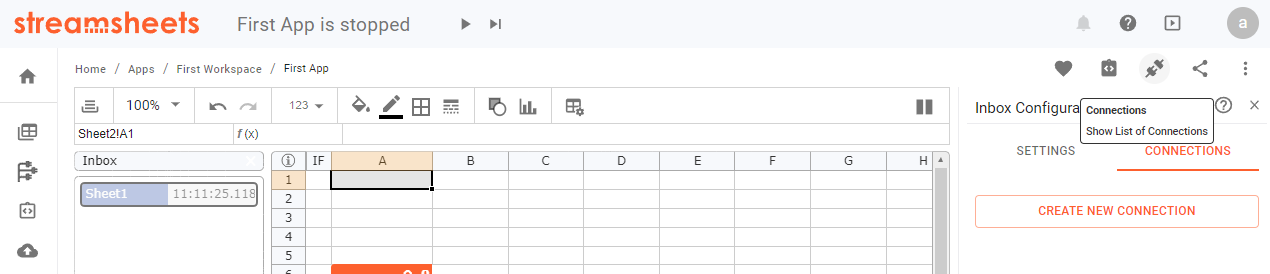
Here it is possible to set up connections to various protocols. These connections can either transfer data into an App or direct it out.
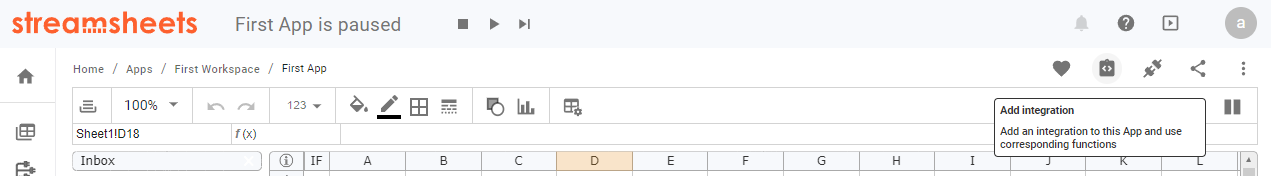
Integrations
The premium version of Streamsheets allows the creation of Integration Accounts, which store API credentials. These can be used via functions in an App. To activate an Integration in an App. Click on the Integration Icon and select the specific Integration to be used.
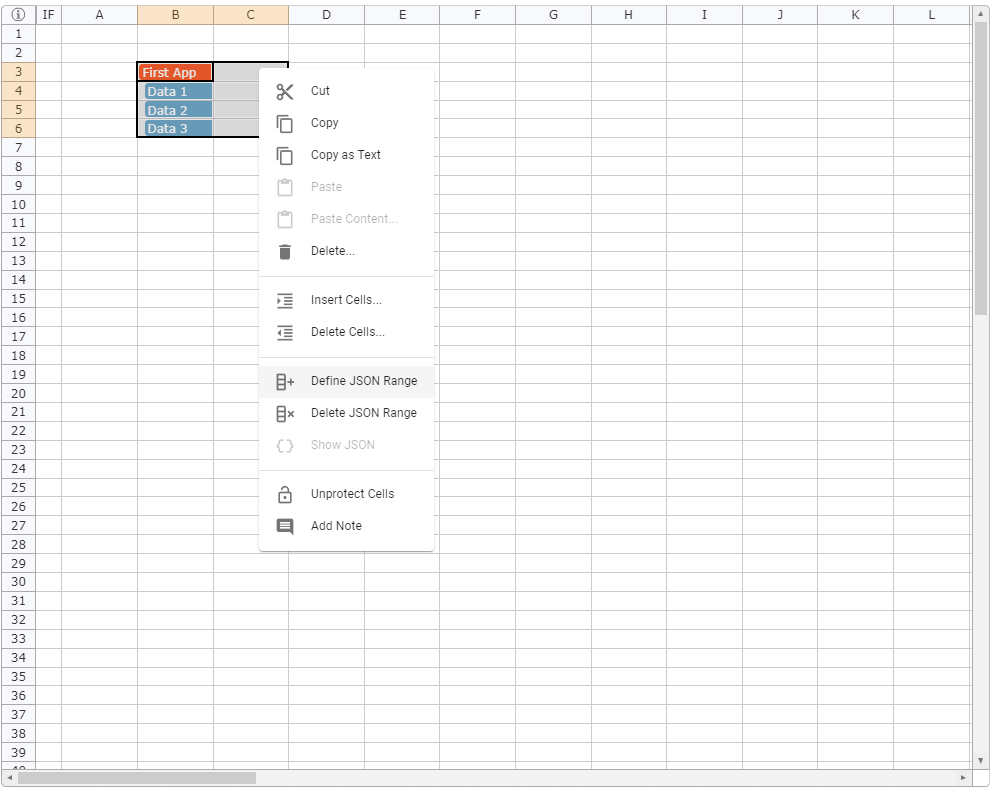
JSON Range
Streamsheets are using the JSON format to transfer and process data. Creating a JSON Range in a Streamsheet helps you to easily structure your data keys in a hierarchical order. This is needed when you are about to transmit data and need it structured in a certain way. In a Streamsheet this is possible by writing all your key-value pairs below each other. After (or before) you are done, select all cells and right-click. Choose “Define JSON-Range” at the bottom of the menu. Now you can start structuring your data using TAB and Shift+TAB to change the hierarchy of a key-value pair.
Learn more about the JSON-Range here
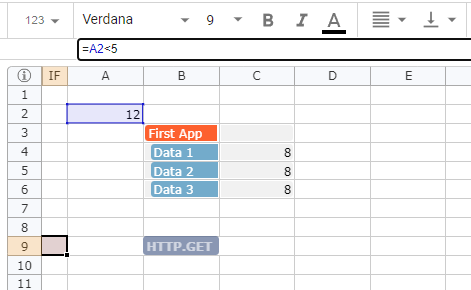
IF Column
The IF-Column is on the left side of your Streamsheet next to column A and offers one individual IF-Cell per row. IF-Cells are a different version of the IF function, but instead of influencing only one cell, they influence all cells in their row! When the given condition is met, the IF-Cell states “TRUE” (green background), if not it states “FALSE” ( red background), either" turning on" or “off” the affiliated row.
Inline Function Help
While typing a function, the inline help automatically offers a list of all possible functions. As soon as one function is selected, the function details are presented. For some functions, the inline help detects possible parameter input and displays it (e.g. Connections).
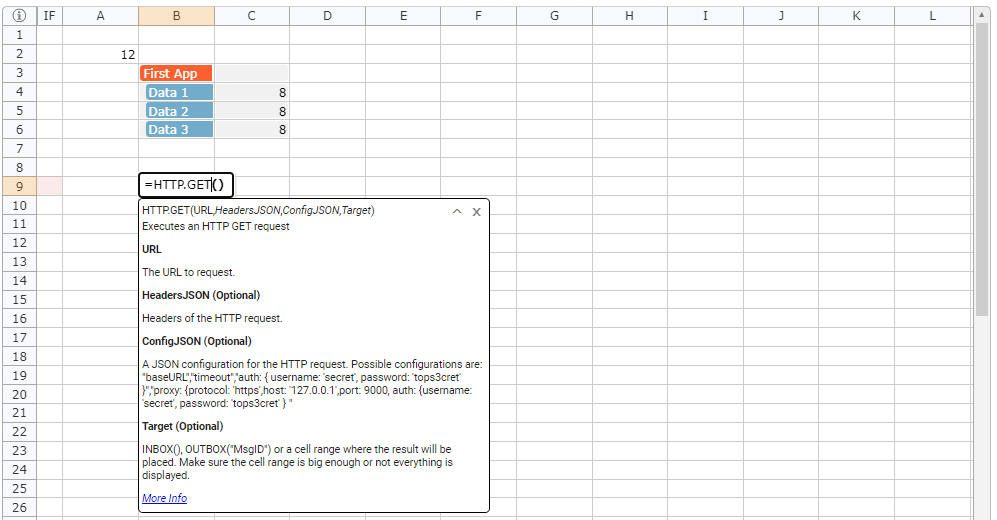
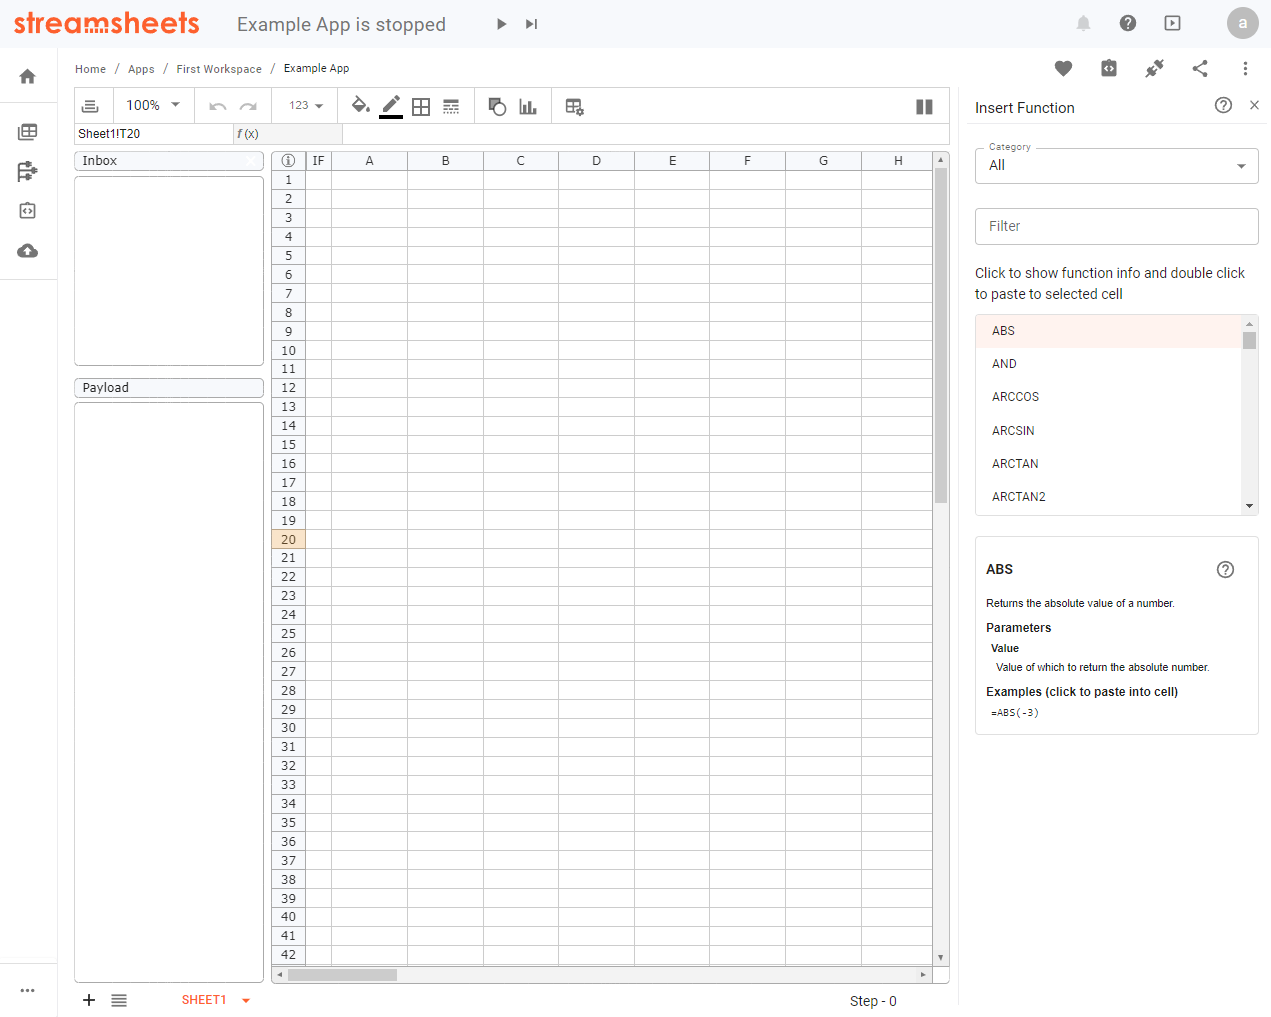
Insert Function
If the inline help is not enough, it is possible to browse functions and read about them in the function help. Click the "f(x)" icon just below the toolbar and on the right side an overview on all existing function opens. It is a great way to discover unknown functions
DOT Notation
Usually, references only reference a cell or cell range. The DOT notation goes one step further. It allows breaking down hierarchies and references to objects, which typically are not directly reachable. These hierarchies can be part of a JSON object, messages in the inbox, or values from shapes. Using the DOT notation is very simple. You can find examples here.
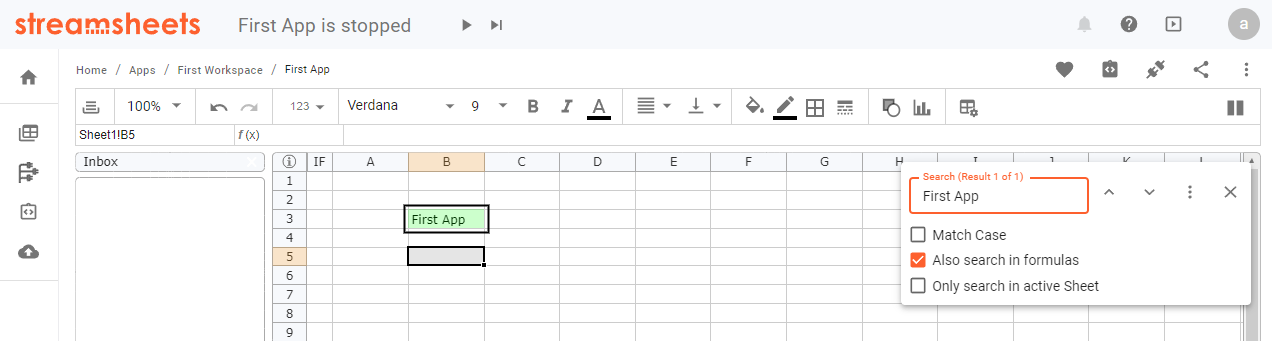
Search
It is possible to search the grid. Use ctrl + f to access the search bar. There are multiple additional options for your search you can include:
- Match Case
- Also, search in formulas
- Only search in active Sheet
Dashboard sheet
The Dashboard sheet helps you to transform your apps into a fully functional dashboard. Compose your UI out of different shapes, interactive elements, and charts. The dashboard sheet is an alternative sheet version, which does not work with cells, but uses a matrix grid to order shapes, charts, and interactive elements to build a full-blown dashboard.
Add a dashboard sheet, by hovering the plus icon in the bottom left corner and clicking the dashboard sheet icon. Per application, only one dashboard sheet is allowed.
The image shows the first setup of the dashboard sheet. A 2x2 matrix.
Every element in the matrix is clickable. To navigate between different hierarchies, keep clicking the same spot. A double click opens the “properties” menu (or right-click “edit properties”). There is a settings menu for each matrix cell and the whole dashboard.
Find out more here.