Charts using Time Series Data
Streamsheets allows to easily store time related data within an internal memory store. This way you can analyze and visualize historical data dynamically. The charts allow to access this data directly by using the TIMEQUERY function as a data source. The charts is then setup to use the result of the query without having to put in the sheet and then referencing it. This is powerful feature to create dashboards for stream data. Below an explanation of the usage and general concept of this feature.
Store Time Series Data
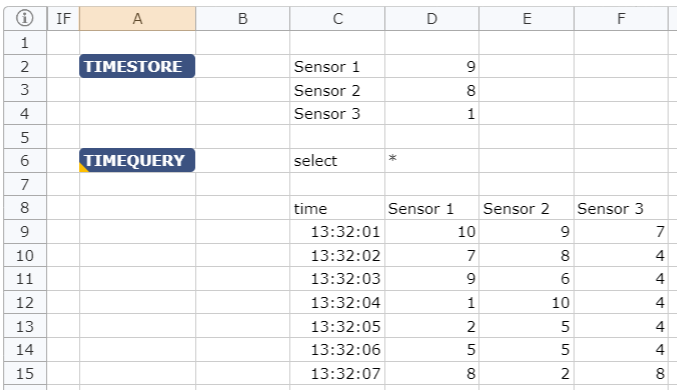
First some random source data is saved whenever the streamsheet calculates. This could happen on incoming data from a stream or just by collecting some random data like in this sample. The TIMESTORE function collects the data give using the current time step.
=TIMESTORE(C2:D4) now saves the data in D2:D4 every time the sheet is calculated. Here we are emulating data from three sensors. In the screenshot below you can see, how the data is internally saved looking at the cell range C8:D15.

Query Data from Time Store
Timestore only saves the data. Now we can query the saved data.
=TIMEQUERY(A2,C6:D6,1,C8:F15) uses the data saved from the above TIMESTORE and use selection criterie in C6:D6 to filter data from the table internally stored. Here we simply query all data. The last parameter allows to output data on a target range on the sheet. This is just done to visualize the internal state. You do not need this output for the chart.
Use Time Store in Chart Series
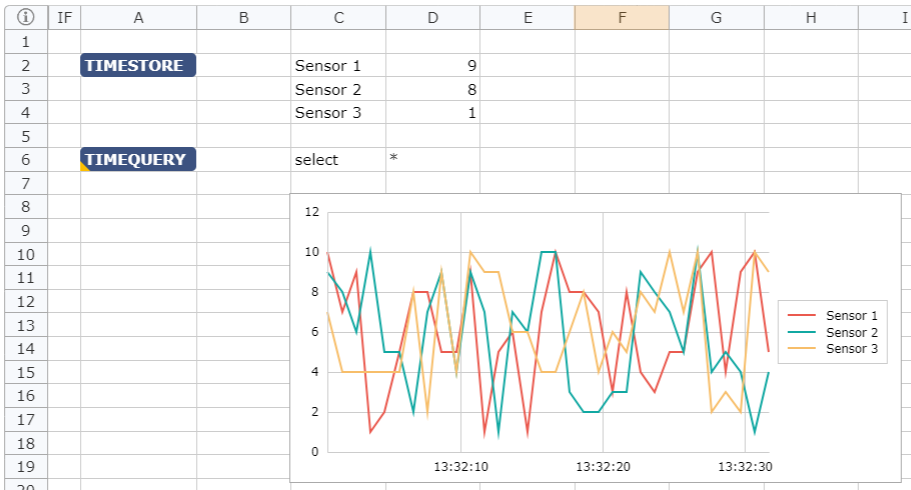
The final step is now to create a chart just selecting the TIMEQUERY cell (A6) and create a Scatter Chart with lines. Streamsheets now interprets the content of the memory store to create a chart showing how the values change over time. This is done by assigning the time field to the x-axis and by creating three data rows using the Sensor 1, Sensor 2 and Sensor 3 data fields.
If you start the App you can observe how the chart display the values developing over time-
Below the source data definition for the first data row. Here you can see that the TIMEQUERY function is used as a datasource and the Sensor 1 field for this data row. The other datarow definitions for this chart look alike except that the Field for Y Values is using Sensor 2 and Sensor 3.
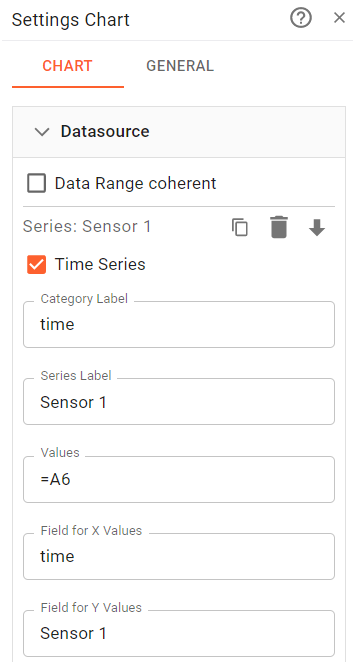
The settings for the DataSource are explained in more detail in Data Source Settings.